Queues Activity Detail view
The Queues Activity Detail view allows you to see real-time information about a specific queue. See a queue’s current interactions, agents, and service levels in one view. Check the number of interactions that are waiting or interacting and the status of agents in that queue. Manually assign waiting interactions in a queue to an available agent. Activate or deactivate agents based on need.
Available columns
To view the available columns, see the Queues Activity Detail view section in the View available columns in performance views by category article.
- To view the consolidated list of available columns in the performance views, see Consolidated view of available columns in performance views.
- To view the list of available columns in the performance views by category, see View available columns in performance views by category.
Access Queues Activity Detail view
To open a queue’s activity detail view, complete the following steps:
- Click Menu > Analytics > Analytics Workspace.
- In the Default section, search for Queue Activity and then click the view name to open it.
- From the Queues Activity Summary view, click a queue’s name.
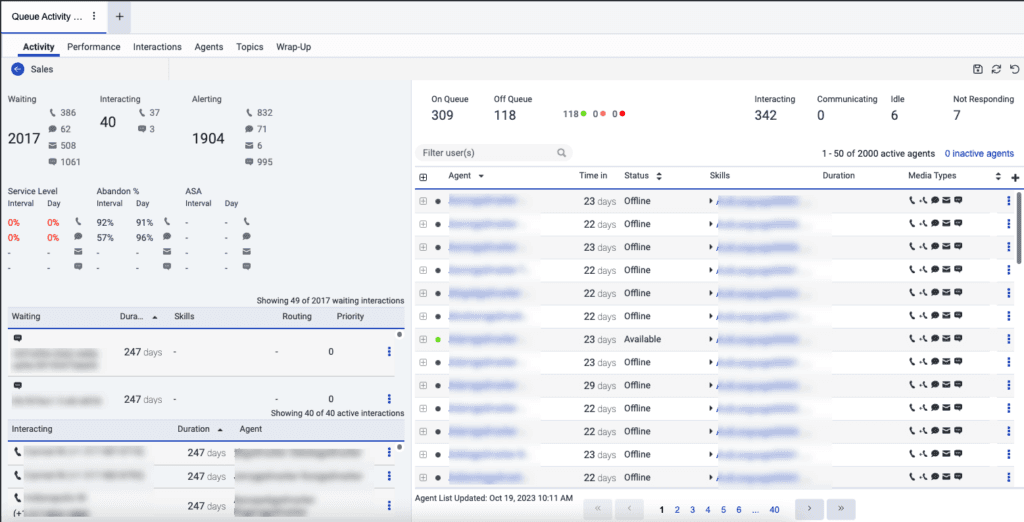
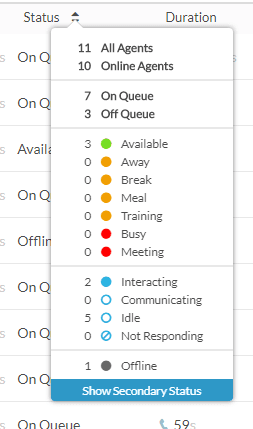
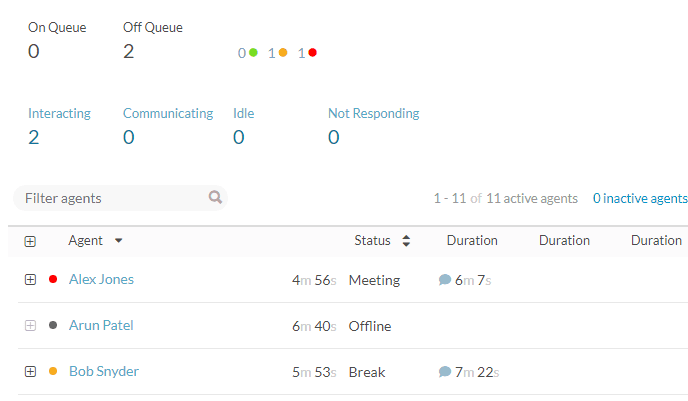
The information in the Queues Activity Detail view updates in real time. The Interaction panel information on the left side and the agent status counts on the upper right always update in real time. The data in the agent table in the lower left, except status and interaction data, do not update live until you apply a status filter.
- When you do not apply a filter, or you apply a filter other than status to the agent table on the right-hand panel, the agent list does not update live, and an Agent List Updated time stamp that indicates the last updated time appears.
- The Queue Activity Detail view reflects the interaction’s priority and skill requirements at the time it began waiting in the queue. Any updates made to priority or skills while the interaction is already in queue, including changes from in-queue flows, are not reflected in the real-time view.
The agent Activate and Deactivate settings prevent the auto-page refresh. When you activate or deactivate an agent, to update the Agent list, click Refresh at the top of the page.
- Calls that are part of the callback appear as a separate interaction from the callback. These interactions appear as two separate interactions.
- The Queues Activity Detail view is based on real-time statistics. The active callback interactions are available for 14 days.
- A consult with two agents appears as two separate interactions.
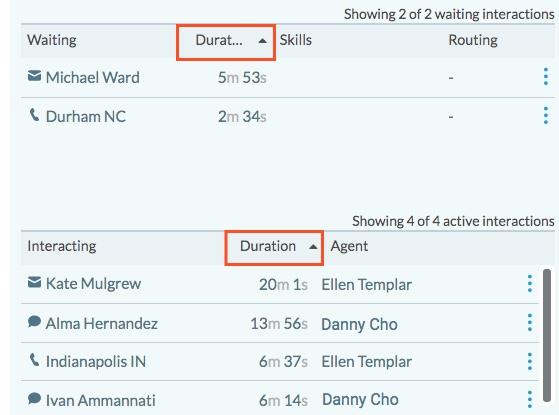
- The Waiting list and Interacting lists show a maximum of 100 interactions per media type across both lists. If a media type has more than 100 interactions, then the lists display only 50 interactions for that media type.
- The Updated time stamp, at the bottom of the agent panel, indicates the last time the list of agents was updated before you apply a filter or click Refresh .
Manage access to Queue Activity detail view based on division permissions
You can manage access to the Queue Activity detail view based on the division permissions of the user. You can restrict the managers and team leads from viewing the agent detail or performance information in the Queue Activity detail view. For example, if you have permission for division 1 and division 2 alone, then you can view the detail or performance information of the agent belonging only to division 1 and division 2 alone. You cannot view the agent detail or performance information of other divisions. The details of the agents belonging to other divisions are blurred out.
If obfuscation is on, you must have the Directory > User – View permission for the division to access any user in that division.
To enable the division permission, use Developer Tools or your application of choice to make the following API call:
PATCH /api/v2/analytics/reporting/settings
{ “queueAgentAccessObfuscation”: true }
Click the image to enlarge.
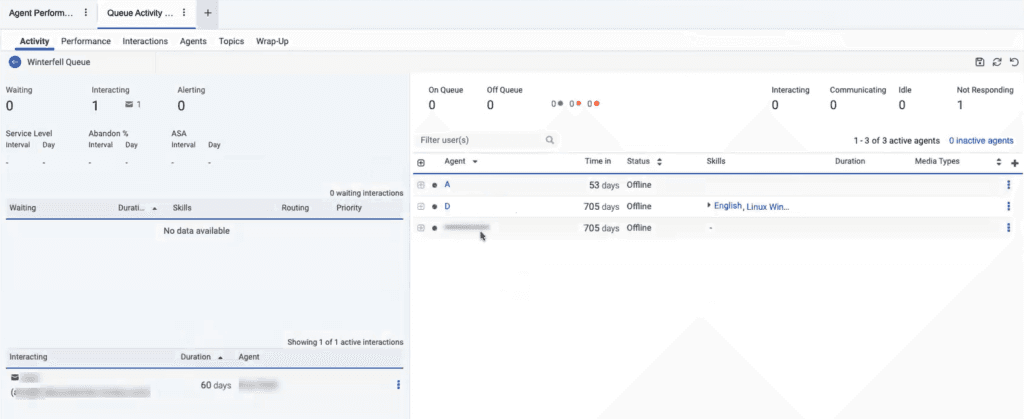
On exporting the Queue Activity detail report, the blurred-out agent name displays as REDACTED.
Click the image to enlarge.

The following information is available in the Queues Activity Detail view.


How filtering works in Queues Activity Detail view
This view supports filtering by either presence values or routing status values, but it does not allow combining both filters simultaneously. Therefore, you should select one of the following filter types that best aligns with your specific question:
- Routing Status to identify which agents the routing system considers available or currently handling contacts. For example, consider a supervisor use case, “Who is handling contacts right now?”
- Presence to determine agents’ client-side availability settings. For example, identify agents who have set their status to Do Not Disturb or Busy.
If you require both perspectives, including both an agent’s presence and routing status at the same time, then you should use the Analytics API endpoints or a report that surfaces both data points. For more information, see Presence and Routing Status troubleshooting.
Customize the view
To show only certain data, customize the Queues Activity Detail view. For example, you can choose to show only certain columns or filter to see agents in certain statuses. Your customizations remain as you leave and return to a view. You can also save your customizations as a saved view to switch between different data of interest in the same view.
Use the filters panel
Use the filters panel to select and apply filters to the data in the view.
To filter the data:
- Click Toggle filters panel .
- Search or scroll to find the filter that you want to use.
- Select or enter the required filter values. For checkbox filters, select the check boxes for the values that you want to include.
- To configure additional filters, repeat the previous steps.
- Click Apply to apply your filter selections to the view.
Filter changes do not affect the data in the view until you click Apply. To discard changes that you made since you last applied the filters, click Cancel. To quickly find a filter or filter value, enter its name in the search box at the top of the filters panel. The search is not case-sensitive and does not filter the data in the view. After you select the required filter values, click Apply to filter the data.
Applied filters appear as tags. To view all the values associated with an applied filter, click the corresponding filter tag. The filters panel provides improved accessibility, including enhanced keyboard navigation, focus states, and screen reader support for filter controls, bringing the panel in line with WCAG 2.1/2.2 AA guidelines.
- Checkbox filter options are cleared by default. Select the check boxes for the values that you want to include in the filter.
- For numeric range filters, you can specify a start value, an end value, or both. A blank value does not apply a limit for that end of the range.
- For duration filters, enter the required hour, minute, or second values. Blank fields do not apply a value.
- When a filter supports multiple media types, select the appropriate check boxes. When only one media type can be selected, select the appropriate radio button. Genesys Cloud automatically prevents incompatible media type combinations.
- Only applied filters are saved with saved views, retained when the page reloads, and included in shareable view URLs. Changes that you make in the filters panel but do not apply are not saved.
- Exports use the currently applied filters. Filter changes that you have not applied are not included in the exported data.
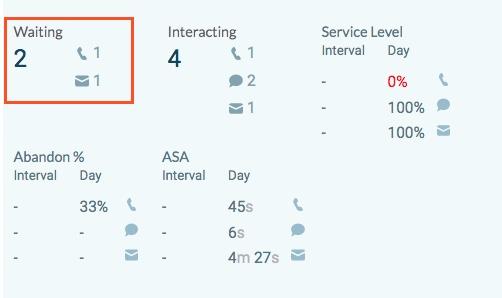
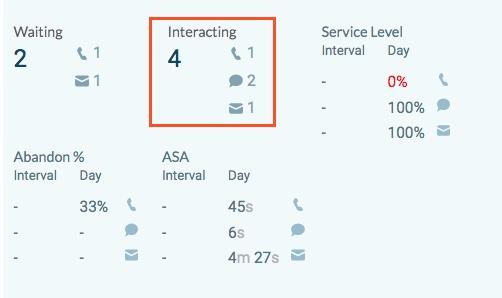
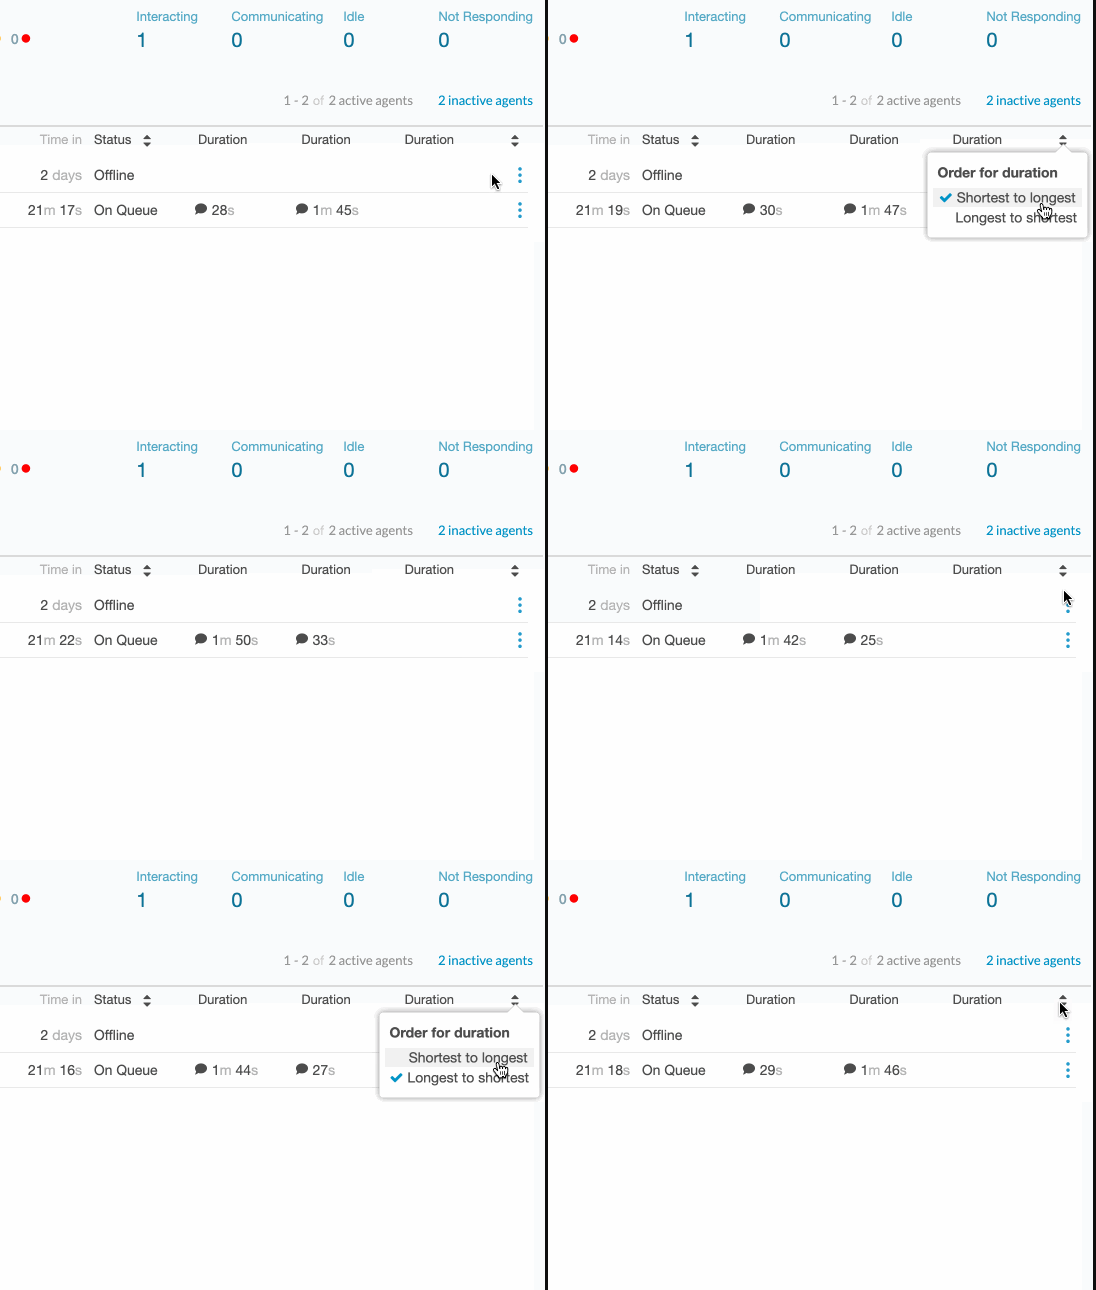
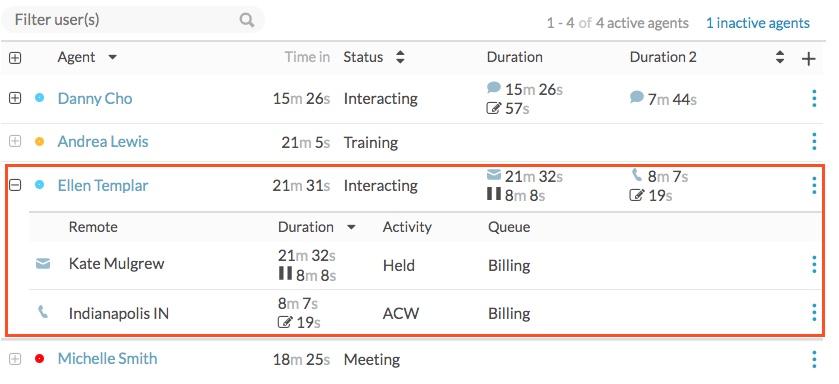
 of a column, and then drag and drop to reorder it within the column picker.

[NEXT] Was this article helpful?
Get user feedback about articles.