Queue Skill Expression Performance view
The following permissions:
- Analytics > Conversation Aggregate – View
- All permissions under Analytics > Data Export
- Routing > Queue – View
- Routing > skillexpressions – View
- UI > Supervisor Performance – View
- UI > Supervisor Queue Details – View
The Queue Skill Expression Performance view provides insight into how skill expressions applied during conversation routing influence queue performance metrics, helping administrators evaluate the effectiveness of their routing logic. With expression-level insights, administrators can better understand usage patterns, evaluate routing effectiveness, and identify expressions that are too restrictive or too broad. These insights support informed routing decisions and help optimize queue performance by refining skill-based routing strategies.
Available columns
To view the available columns, see the Queue Skill Expression Performance view section in the View available columns in performance views by category article.
- To view the consolidated list of available columns in the performance views, see Consolidated view of available columns in performance views.
- To view the list of available columns in the performance views by category, see View available columns in performance views by category.
Set a default time zone in the workspace
You can set the default time zone in the analytics workspace before viewing any analytics view.
To set the default time zone in the workspace, follow these steps:
- Click Performance > Workspace.
- Click Menu > Analytics > Analytics Workspace.
- On the left side, from the Time zone drop-down menu, select the required time zone as the default time zone for the analytics workspace.
Access Queue Skill Expression Performance view
To see the view, perform the following:
- Click Menu > Analytics > Analytics Workspace.
- In the Default section, search for Queue Skill Expression and then click the view name to open it.
This view does not update automatically. To see the most current data, click Refresh .
To save the view with your filter and column settings, click Save View .
To export the data in the view, click Toggle export panel .
Customize the view
To show only certain data, customize the view. For example, you can choose to show only certain columns or filter to see certain types of interactions.
To customize analytics views, use the date filter.
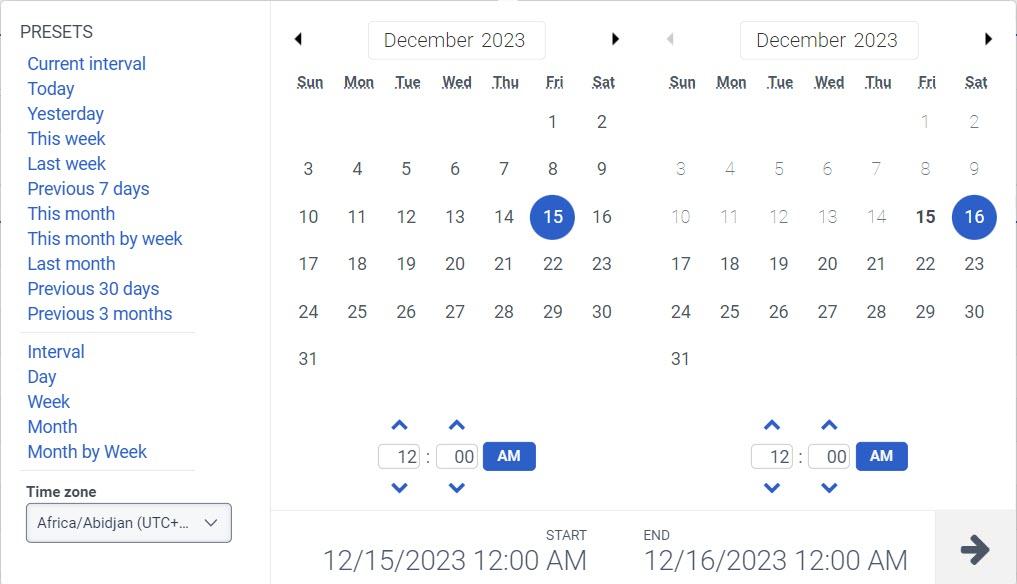
To filter metrics by date or configure a custom date range, use presets. When filtering metrics for this view, select any custom date range up to 366 days.
To use a preset to filter metrics, complete the following steps:
- To display the date filter, click the date.
- In the Presets list, select a preset date option.
Date presets
| Presets | Description |
|---|---|
| Current interval | Shows data for the current 30-minute time period. |
| Today | Shows data for the time period that includes the current interval. |
| Yesterday | Shows data for the previous day. |
| This week | Shows data for a Sunday through Saturday time period. |
| Last week | Shows data for the previous week, Sunday through Saturday. |
| Previous 7 days | Shows data for the previous seven days. |
| This month | Shows data for the current month, with no extra days. |
| This month by week | Shows data for the current calendar month starting on Sunday and ending on Saturday, including extra days if the month does not start on Sunday or end on Saturday. |
| Last month | Shows data for the previous calendar month with no extra days. |
| Previous 30 days | Shows data for the previous 30 days. |
| Previous 3 months | Shows data for the previous 3 months. For example, Nov 1, 2022 – Jan 31, 2023. |
| Interval | Shows data for a 30-minute time period. |
| Day | Shows data for a single 24-hour day. |
| Week | Shows data for a Sunday through Saturday time period. |
| Month | Shows data for the exact month with no extra days. If the current month is selected, you can see the data up to the current date. |
| Month by Week | Shows data for a calendar month starting on Sunday and ending on Saturday, including extra days if the month does not start on Sunday or end on Saturday. |
- To use a custom date range to filter metrics, complete the following steps:
- Click the date to display the date filter.
- Select a start date and an end date on the calendar, and click the filter arrow .
- To view data for a different time period using the same date presets, click the arrows on either side of the date display. For example, to view data for the previous day, click the Day preset, and then click the arrow on the left side of the date.
- To view data for a different time zone using the same date presets, from the Time zone drop-down menu, select the required time zone. You can create and save reports with the same selected time zone.
To enter the names of queues you want to view, click the Select search box. Enter the name of the queue and select the queue from the search results. You can continue to enter and select more queues to add to the view.
Tables are updated to provide a more accessible and user-friendly experience through enhanced keyboard navigation, screen reader support, focus management, and improved accessibility compliance. These enhancements help users interact with table content more effectively. You can also resize columns and scroll horizontally, making it easier to view and work with large datasets.
To show or hide columns:
- At the upper right corner of the table header, click the Edit columns icon. The Add/Remove Column pane appears.
- Click the Manage columns tab.
- (Optional) To sort the columns in ascending or alphabetical order, click Sort by > Column Name A-Z.
- (Optional) To sort the columns in descending or reverse alphabetical order, click Sort by > Column Name Z-A.
- (Optional) To categorize or uncategorize the columns, click Sort by, and enable or disable the Group by Categories toggle.
- Search or scroll to select the columns you want to view. Note: You can also use keyboard navigation to choose the columns.
- Click Save. The selected columns appear on the screen. Note: The column selections appear only after saving the changes and do not apply to the table immediately.
To reorder the columns within the column picker:
- At the upper right corner of the table header, click the Edit columns icon. The Add/Remove Column pane (column picker) appears.
- Click the Reorder columns tab.
- Click the grid icon
 of a column, and then drag and drop to reorder it within the column picker.
- You can also use keyboard shortcuts to reorder the columns. To reorder the columns using the keyboard, perform the following:
- Click to select the grid icon of the column to be reordered, and on the keyboard, press the Spacebar.
- To position the column, use the Up or Down arrow keys.
- Press the Spacebar. The chosen column is reordered.
- To improve keyboard accessibility and provide a more consistent user experience, column reordering is no longer performed by dragging column headers directly in the table. To reorder columns, use the Reorder Columns tab.
To reset a view to default column settings, click Reset view to defaults .
You can select up to 20 columns.
To better accommodate your screen size and reporting needs, you can customize the table layout in the view.
Resize columns
To resize the width of a column:
- Hover over the boundary between two column headers.
- When the resize cursor appears, click and drag the column border left or right.
- Release the mouse button when the column reaches the required width.
Resizing columns can help you view longer values, including conversation IDs, user names, or other data, without truncation.
Scroll horizontally
If the view contains more columns than can fit within the available screen width, a horizontal scroll bar appears at the bottom of the table.
To view more columns:
- Use the horizontal scroll bar at the bottom of the table.
- Scroll left or right to access columns that are not currently visible.
Horizontal scrolling lets you view all available data while maintaining your selected column widths.
To filter by media type, perform the following:
- Click the Toggle filters panel icon .
- Select the required media type.
- When filtering, you can select more than one media type. Click the relevant media type to select or deselect the type.
- You cannot select the voice and callback types at the same time.
- If you select voice, the callback option will be deselected. If you select callback, the voice interaction will be deselected.
- The available media types may vary from those shown above.
The selected media type icon is displayed above the column headers. For more information about various media types and their settings, see the Set behavior and thresholds for all interaction types section in the Create and configure queues.
To filter by information about the interaction, click Toggle filters panel icon , and then search or scroll to select the filter you want to use.
Interaction filters
| Filter | Description |
|---|---|
| Message Type | Displays metrics for interactions of the selected ACD message type. This filter only appears if you set the media type filter to Message. If you do not have any message types selected, the view displays information for all message types. Genesys Cloud currently supports the following message types: Apple Messages for Business, Facebook, Instagram, Line, Open, SMS, Web Messaging, WhatsApp, and X (Twitter). Note: Line message type is deprecated, but Genesys Cloud still supports display filtering. |
| DNIS | Displays information for interactions with the selected original DNIS number. This DNIS number was dialed at the beginning of the interaction.
|
| Session DNIS | Displays information for interactions with the selected DNIS number. The DNIS number could have been dialed any time during the interaction.
|
| User | Displays information associated with the selected users. Filter for multiple users at one time by entering other users and searching again. To see and select inactive users in the User filter search, select Include inactive users. To see and select deleted users in the User filter search, select Include deleted users. |
| Provider | The source provider for the conversation. For example, Genesys Cloud EMAIL, Edge, and so on. |
| Routing Requested | Displays the routing methods that were requested for the interaction. Gives insight into each of the routing methods the conversation went through prior to being answered, abandoned, or flow-out. The routing data is relevant beginning September 5, 2020. |
| Routing Used | Displays the routing method that was used to get to the agent who answered the interaction. The routing data is relevant beginning September 5, 2020. |
| External Tag | Displays information for interactions that have the External Tag attached to the conversation record. Note: External tag data is not available for web chat interactions. |
[NEXT] Was this article helpful?
Get user feedback about articles.