Genesys Cloud provides comprehensive survey analytics through its Survey Performance view, enabling users to analyze survey distribution, response metrics, and customer feedback across multiple dimensions. Access requires CX 3, CX 4, CX 3 Digital, or EX licensing with appropriate Analytics and Survey Form viewing permissions.
The platform offers extensive customization capabilities, including configuration of up to 20 columns with drag-and-drop reordering, grouping, and sorting functionality. Column resizing and horizontal scrolling accommodate longer values such as conversation IDs and usernames, while a Reset view to defaults option restores original configurations without altering underlying data. Users can navigate the Survey Performance view through Performance > Workspace > Employee Engagement > Survey Performance or by searching within the Analytics Workspace Default section.
Filtering functionality supports multiple concurrent filters across interaction details (User, Queue, Wrap-Up codes, Skills, Languages) and survey metrics (Survey Score, NPS, Survey Type, Response Status). Media type filtering allows selection of multiple interaction types simultaneously, except for mutually exclusive voice and callback options. NPS range filtering enables selection within, above, or below specified thresholds, while Response Status filtering categorizes surveys as Full or Partial based on question completion.
Date filtering supports preset options including Today, Yesterday, weekly and monthly intervals, and Previous 3 and 30-day ranges, with custom date ranges extending up to six months of historical data. Users can navigate between time periods using directional arrows and switch time zones via dropdown selection, with chosen settings persisting in saved reports. Time zone configuration is available through Performance > Workspace or Menu > Analytics > Analytics Workspace.
The Survey Detail view provides granular analysis through row expansion and version date selection, allowing users to access detailed question and response information. Genesys Cloud records survey data based on send date rather than completion date. Manual data refresh functionality is available through the Refresh button, as the view does not auto-update. Custom filter configurations and views are saveable for recurring access with display preferences maintained across sessions, and data can be exported using the Export function
The following license:
Genesys Cloud CX 3, Genesys Cloud CX 4, or Genesys Cloud EX
The following permissions:
Analytics > Survey Aggregate > View
Quality > Survey Form > View
The Survey Summary view displays statistics for survey forms sent to customers after an interaction. Use it to find out how many surveys Genesys Cloud sent, the status of those surveys, and the results of the surveys. Each row in the view displays a survey form and its related metrics.
Available columns
To view the available columns, see the Survey Performance Summary view section in the View available columns in performance views by category article.
Note: Genesys Cloud displays survey data in the interval when it sent the survey, not in the interval that the customer answers the survey. For example, if Genesys Cloud sends the survey on January 10, and the customer completes the survey on February 15, then the data for the survey appears on January 10.
View more details about a survey form
To see the form versions and related metrics for a survey form, click beside the survey form’s row. The form versions and their data display under the survey form’s row.
To see the survey questions and responses for that form version, click the date of the version. The Survey Detail view for that version opens.
Note: You can only view more details about surveys with responses. The in those surveys’ rows is unavailable.
Customize the view
To show only certain data, customize the view. For example, you can choose to show only certain columns or filter to see certain types of interactions. To quickly switch between different data of interest in the same view, you can also save your filter and column settings as a saved view.
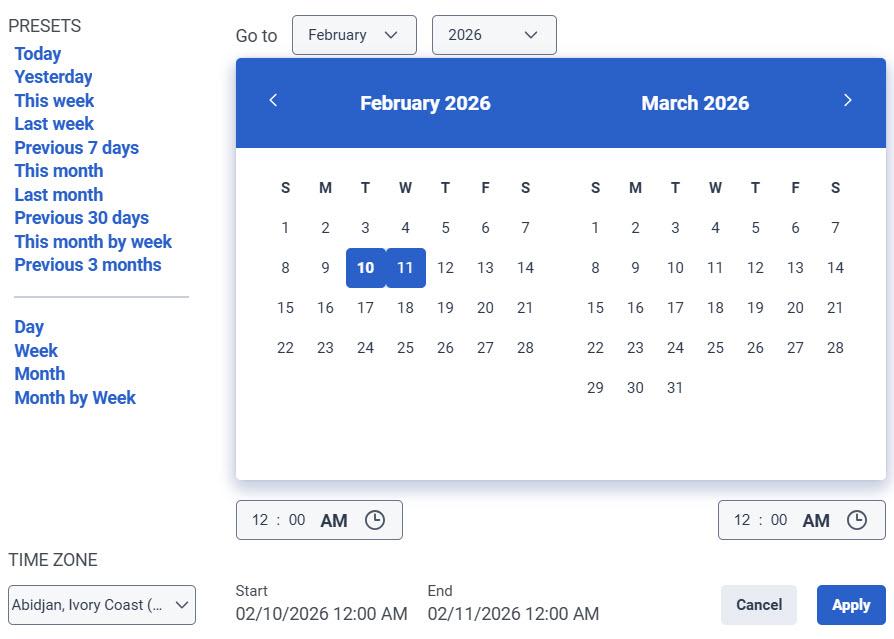
To customize analytics views, use the date filter.
To filter metrics by date or configure a custom date range, use presets. When filtering metrics for this view, select any custom date range up to 6 months.
To use a preset to filter metrics, complete the following steps:
To display the date filter, click the date.
In the Presets list, select a preset date option.
Date presets
Presets
Description
Today
Shows data for the time period that includes the current interval.
Yesterday
Shows data for the previous day.
This week
Shows data for a Sunday through Saturday time period.
Last week
Shows data for the previous week, Sunday through Saturday.
Previous 7 days
Shows data for the previous seven days.
This month
Shows data for the current month, with no extra days.
Last month
Shows data for the previous calendar month with no extra days.
Previous 30 days
Shows data for the previous 30 days.
This month by week
Shows data for the current calendar month starting on Sunday and ending on Saturday, including extra days if the month does not start on Sunday or end on Saturday.
Previous 3 months
Shows data for the previous 3 months. For example, Nov 1, 2022 – Jan 31, 2023.
Day
Shows data for a single 24-hour day.
Week
Shows data for a Sunday through Saturday time period.
Month
Shows data for the exact month with no extra days. If the current month is selected, you can see the data up to the current date.
Month by Week
Shows data for a calendar month starting on Sunday and ending on Saturday, including extra days if the month does not start on Sunday or end on Saturday.
To use a custom date range to filter metrics, complete the following steps:
Click the date to display the date filter.
Select a start date and an end date on the calendar.
Click Apply.
To view data for a different time period using the same date presets, click the arrows on either side of the date display. For example, to view data for the previous day, click the Day preset, and then click the arrow on the left side of the date.
To view data for a different time zone using the same date presets, from the Time zone drop-down menu, select the required time zone. You can create and save reports with the same selected time zone.
To filter by media type, perform the following:
Click the Toggle filters panel icon .
Select the required media type.
Notes:
When filtering, you can select more than one media type. Click the relevant media type to select or deselect the type.
You cannot select the voice and callback types at the same time.
If you select voice, the callback option will be deselected. If you select callback, the voice interaction will be deselected.
The available media types may vary from those shown above.
The selected media type icon is displayed above the column headers. For more information about various media types and their settings, see the Set behavior and thresholds for all interaction types section in the Create and configure queues.
To show or hide columns:
At the upper right corner of the columns, click the Pick columns icon. The Add/Remove Column pane appears.
Click the Manage columns tab.
(Optional) To sort the columns in ascending or alphabetical order, click Sort by > Column Name A-Z.
(Optional) To sort the columns in descending or reverse alphabetical order, click Sort by > Column Name Z-A.
(Optional) To categorize or uncategorize the columns, click Sort by and enable or disable the Group by Categories toggle.
Search or scroll to select the columns you want to view.
Note: You can also use keyboard navigation to choose the columns.
Click Save. The selected columns appear on the screen.
Note: The column selections appear only after saving the changes and do not apply to the table immediately.
To reorder the columns within the column picker:
At the upper right corner of the columns, click the Pick columns icon. The Add/Remove Column pane (column picker) appears.
Click the Reorder columns tab.
Click the grid icon of a column, and then drag and drop to reorder it within the column picker.
Note: You can also use keyboard shortcuts to reorder the columns. To reorder the columns using the keyboard, perform the following:
Click to select the grid icon of the column to be reordered, and on the keyboard, press the Spacebar.
To position the column, use the Up or Down arrow keys.
Press the Spacebar. The chosen column is reordered.
To rearrange the columns outside the column picker, click a column header and drag it.
To reset a view to default column settings, click Reset view to defaults .
You can select up to 20 columns.
To enter the survey you want to view, click the Filter by survey form(s) search icon . Enter the survey name and select the survey from the search results. You can continue to enter and select more surveys to add to the view.
Filter by selecting multiple surveys
You can select multiple surveys to filter by.
In the survey’s row, select the check box.
Continue selecting survey check boxes to add to filters.
Click Add to filters.
To filter by information about the interaction, click Filters , and then search or scroll to select the filter you want to use.
Interaction filters
Filter
Description
User
Displays interactions associated with the selected users.
Filter for multiple users at one time by entering other users and searching again.
To see and select inactive users in the User filter search, select Include inactive users.
Queue
Displays metrics for interactions associated with the selected queues.
Filter for multiple queues at one time by entering other queues and searching again.
Wrap-Up
Displays interactions that have the selected wrap-up codes.
Filter for multiple wrap-up codes at one time by entering other codes and searching again.
Skills
Displays metrics for interactions with agents who have the selected skills.
Filter for multiple skills at one time by entering other skills and searching again.
Languages
Displays metrics for interactions with agents who have the selected languages.
Filter for multiple languages at one time by entering other languages and searching again.
Click Filters.
Click the Surveys tab.
Search or scroll to select the filter you want to use.
Filter
Description
Survey Score
Displays the surveys by scores:
Range: Displays the surveys with scores within the selected range.
Above: Displays the surveys with scores equal to or above the selected score.
Below: Displays the surveys with scores equal to or below the selected score.