Genesys Cloud's Flow Topics view displays comprehensive statistics and speech and text analytics topic data for interactions entering architect flows, presenting flow metrics and sentiment analytics distributed over time. The view enables users to add topics of interest as columns to compare topic detection across flows and identify flow challenges through outlier analysis, with topic details accessible via the Topic name column header.
Access to this functionality requires specific permissions including Architect flow view and search capabilities, Analytics flow aggregate view, Speech and text analytics topic view, and Analytics speech and text analytics aggregates view. The system processes topic metrics only after session classification as ended, using session end time rather than start time for metric processing, with a 72 to 96-hour reporting update window session completion and a 72-hour inactivity requirement for asynchronous interactions to determine conversation completion.
Users can customize the view through multiple mechanisms including setting default time zones, filtering by users across name, division, group, role, or location parameters, and applying interaction filters. Column management capabilities allow users to show, hide, rearrange, and resize columns, with support for up to 20 columns and alphabetical sorting options. Customizations persist across navigation and can be saved as named views for quick dataset switching. The interface incorporates enhanced accessibility features including improved keyboard navigation, screen reader support, and focus management.
Date filtering supports preset options spanning Current Interval, Today, Yesterday, weekly and monthly ranges, and custom date ranges up to one month, with time zone adjustment capabilities and directional navigation between periods. Media type filtering allows multiple interaction types simultaneously, except voice and callback types which cannot be selected concurrently. Flow name filtering operates through search functionality with multi-flow selection via checkboxes, while interaction detail filters support multiple message types including Apple Messages for Business, Facebook, Instagram, SMS, Web Messaging, WhatsApp, and X.
Additional filtering dimensions include the Detected Topic filter for layered analysis, Includes (Any) filter using OR logic for same-level topics and AND logic across different levels, Wrap-Up filter for wrap-up codes, From and To filters for email and phone searches requiring complete addresses, ANI filter supporting partial searches from the number's start, DNIS filter for originally dialed numbers, Direction filter for inbound/outbound categorization, Queue filter for queue-associated interactions, Flow Version filter for IVR flow versions, Participant filter for interaction type categorization, and Conversation Duration and Total Handle Time filters supporting range, above, and below threshold searches. The view provides data export capabilities and access to Flow Topics Detail view and Flow performance views through clickable elements
The following permissions:
Architect > flow – view
Analytics > flow aggregate – view
Architect > flow – search
Speech and text analytics > topic – view
Analytics > speech and text analytics aggregates – view
The Flow Conversation Insights view displaysstatistics and speech and text analytics conversation data for interactions that enter an architect flow.For information about speech and text analytics topics, see About programs, topics, and phrases.
In the Flow Conversation Insights view, you can view flow data (for example, Average Flow) and sentiment data (Average Sentiment Score, Negative Interactions, Negative Interactions %, Neutral Interactions, Neutral Interactions %, Positive Interactions, Positive Interactions %, Sentiment) distributed over time. Also, you can add categories and topics of interest in columns, so that you are able to make categories or topic detection comparison between flows. You can hover over the Topic name column header to get information about the topic including Topic Name, Description, and Participants. You can hover over the Category Name column header to get information about the category, including Category Name and Description. By looking for outliers in specific conversations, this view can be used to identify flow challenges.
Available columns
To view the available columns, see the Flow Conversation Insights view section in the View available columns in performance views by category article.
This view does not update as new interactions occur. To see new conversations, click Refresh .
Note: Each view has its own permissions. For permission requirements, see each view’s article. For more information, see Flow performance views. Speech and Text Analytics requires 72 hours of inactivity for asynchronous interactions (such as email and messaging) to determine that a conversation has ended. When processing the topic metrics, the system uses the session end time rather than the session start time. The topic metrics are emitted only after the session is classified as ended. Therefore, it takes 72 to 96 hours for the topic reporting to be completely updated after the session end time.
Customize the view
To show only certain data, customize the view. For example, you can choose to show only certain columns or filter to see certain types of interactions. Your customizations remain as you navigate from view to view or leave and return to a view.
Use the filters panel
Use the filters panel to select and apply filters to the data in the view.
To filter the data:
Click Toggle filters panel .
Search or scroll to find the filter that you want to use.
Select or enter the required filter values. For checkbox filters, select the check boxes for the values that you want to include.
To configure additional filters, repeat the previous steps.
Click Apply to apply your filter selections to the view.
Filter changes do not affect the data in the view until you click Apply. To discard changes that you made since you last applied the filters, click Cancel. To quickly find a filter or filter value, enter its name in the search box at the top of the filters panel. The search is not case-sensitive and does not filter the data in the view. After you select the required filter values, click Apply to filter the data.
Applied filters appear as tags. To view all the values associated with an applied filter, click the corresponding filter tag. The filters panel provides improved accessibility, including enhanced keyboard navigation, focus states, and screen reader support for filter controls, bringing the panel in line with WCAG 2.1/2.2 AA guidelines.
Notes:
Checkbox filter options are cleared by default. Select the check boxes for the values that you want to include in the filter.
For numeric range filters, you can specify a start value, an end value, or both. A blank value does not apply a limit for that end of the range.
For duration filters, enter the required hour, minute, or second values. Blank fields do not apply a value.
When a filter supports multiple media types, select the appropriate check boxes. When only one media type can be selected, select the appropriate radio button. Genesys Cloud automatically prevents incompatible media type combinations.
Only applied filters are saved with saved views, retained when the page reloads, and included in shareable view URLs. Changes that you make in the filters panel but do not apply are not saved.
Exports use the currently applied filters. Filter changes that you have not applied are not included in the exported data.
To customize analytics views, use the date filter.
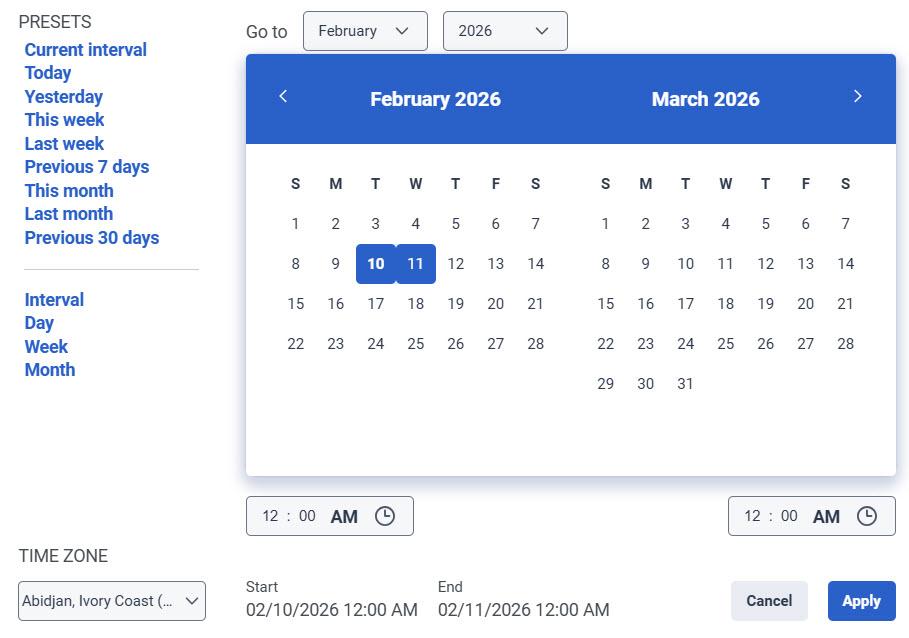
To filter metrics by date or configure a custom date range, use presets. When filtering metrics for this view, select any custom date range up to one month.
To use a preset to filter metrics, complete the following steps:
Click the date to display the date filter.
In the Presets list, select a preset date option.
Date presets
Presets
Description
Current interval
Shows data for the current 30-minute time period.
Today
Shows data for the time period that includes the current interval.
Yesterday
Shows data for the previous day.
This week
Shows data for a Sunday through Saturday time period.
Last week
Shows data for the previous week and Sunday through Saturday.
Previous 7 days
Shows data for the previous seven days.
This month
Shows data for the current month with no extra days.
Last month
Shows data for the previous calendar month with no extra days.
Previous 30 days
Shows data for the previous 30 days.
Interval
Shows data for a 30-minute time period.
Day
Shows data for a single 24-hour day.
Week
Shows data for a Sunday through Saturday time period.
Month
Shows data for the exact month with no extra days. If the current month is selected, you see the data up to the current date.
To use a custom date range to filter metrics, complete the following steps:
To display the date filter, click the date.
Select a start date and an end date on the calendar.
Click Apply.
To view data for a different time period using the same date presets, click the arrows on either side of the date display. For example, to view data for the previous day, click the Day preset, and then click the arrow on the left side of the date.
To view data for a different time zone using the same date presets, from the Time zone drop-down menu, select the required time zone. You can create and save reports with the same selected time zone.
You can select the column header for the topic to see a distribution of that topic across the selected time period.
To filter by media type, perform the following:
Click the Toggle filters panel icon .
Select the required media type.
Click Apply.
Notes:
When filtering, you can select more than one media type. Click the relevant media type to select or deselect the type.
You cannot select the voice and callback types at the same time.
If you select voice, the callback option will be deselected. If you select callback, the voice interaction will be deselected.
The available media types may vary from those shown above.
The selected media type icon is displayed above the column headers. For more information about various media types and their settings, see the Set behavior and thresholds for all interaction types section in the Create and configure queues.
Data in the view can be displayed in a chart. To view the chart, click the Show/Hide chart icon .
Tables are updated to provide a more accessible and user-friendly experience through enhanced keyboard navigation, screen reader support, focus management, and improved accessibility compliance. These enhancements help users interact with table content more effectively. You can also resize columns and scroll horizontally, making it easier to view and work with large datasets.
To show or hide columns:
At the upper right corner of the table header, click the Edit columns icon. The Add/Remove Column pane appears.
Click the Manage columns tab.
(Optional) To sort the columns in ascending or alphabetical order, click Sort by > Column Name A-Z.
(Optional) To sort the columns in descending or reverse alphabetical order, click Sort by > Column Name Z-A.
(Optional) To categorize or uncategorize the columns, click Sort by and enable or disable the Group by Categories toggle.
Search or scroll to select the columns you want to view.
Note: You can also use keyboard navigation to choose the columns.
Click Save. The selected columns appear on the screen.
Note: The column selections appear only after saving the changes and do not apply to the table immediately.
To reorder the columns within the column picker:
At the upper right corner of the table header, click the Edit columns icon. The Add/Remove Column pane (column picker) appears.
Click the Reorder columns tab.
Click the grid icon of a column, and then drag and drop to reorder it within the column picker.
Notes:
You can also use keyboard shortcuts to reorder the columns. To reorder the columns using the keyboard, perform the following:
Click to select the grid icon of the column to be reordered, and on the keyboard, press the Spacebar.
To position the column, use the Up or Down arrow keys.
Press the Spacebar. The chosen column is reordered.
To improve keyboard accessibility and provide a more consistent user experience, column reordering is no longer performed by dragging column headers directly in the table. To reorder columns, use the Reorder Columns tab.
To reset a view to default column settings, click Reset view to defaults .
You can select up to 20 columns.
To better accommodate your screen size and reporting needs, you can customize the table layout in the view.
Resize columns
To resize the width of a column:
Hover over the boundary between two column headers.
When the resize cursor appears, click and drag the column border left or right.
Release the mouse button when the column reaches the desired width.
Resizing columns can help you view longer values, such as conversation IDs, user names, or other data, without truncation.
Scroll horizontally
If the view contains more columns than can fit within the available screen width, a horizontal scroll bar appears at the bottom of the table.
To view more columns:
Use the horizontal scroll bar at the bottom of the table.
Scroll left or right to access columns that are not currently visible.
Horizontal scrolling lets you view all available data while maintaining your selected column widths.
Note: Column resizing and horizontal scrolling affect only the display of the current view and do not change the underlying data.
You can select up to 20 topic columns.
Filter according to the flow name
Click the Filter flow(s) search icon to filter the flows view. Enter the name of the flow in the Filter flow(s) field, and select the flow from the search results.
You can continue to enter and select additional flows to add to the view.
Filter using multiple flows
Select the checkbox next to 2 or more flows and click Add to filters.
Note: To stop filtering according to a specific flow, click next to the flows name above the table.
To filter by information about the interaction:
Click Toggle filters panel .
Search or scroll to select the filter you want to use.
Click Apply.
Interactions filters
Filter
Description
Message Type
The ACD message type used. Genesys Cloud currently supports the following message types: Apple Messages for Business, Facebook, Instagram, Line, Open, SMS, Web Messaging, WhatsApp, and X (Twitter).
Note: Line message type is deprecated, but Genesys Cloud still supports display filtering.
Detected Topic
You can filter the data in the Flow Topics summary to view only interactions that contain certain topics, which allows you to perform a layering analysis of the interactions. By default, the Includes (Any) option is enabled. You can select single or multiple topics at the same level or different levels using OR/AND functions.
When you add multiple topics at the same level, an OR is used between the topics. For example, if you add Topic A and Topic B to the first level under Includes (Any), the filtered data shows interactions where Topic A OR Topic B is detected.
When you add topics at different levels, an AND is used between the topics. For example, if you add Topic A to the first level using Includes (Any) and add Topic B to the second level using + AND with topics, the filtered data shows interactions where Topic A AND Topic B are detected.
Detected Category
You can filter the data to view only conversations that contain certain categories, which allows you to perform a layering analysis of the conversations. By default, the Includes (Any) option is enabled. You can select single or multiple categories at the same level or different levels using OR/AND functions.
When you add multiple categories at the same level, an OR functionality is used between the categories. For example, if you add Category A and Category B to the first level under Includes (Any), the filtered data shows conversations where Category A OR Category B is detected.
When you add categories at different levels, an AND functionality is used between the topics. For example, if you add Category A to the first level using Includes (Any) and add Category B to the second level using + AND with topics, the filtered data shows conversations where Category A AND Category B are detected.
Wrap-Up
Displays interactions that have the selected wrap-up codes.
From
Displays information for interactions sent from the selected email addresses.
Enter the full email address, such as person@example.com. The filter cannot search for a partial address.
Filter for multiple addresses at one time by entering other addresses and searching again.
When searching for a phone number, enter the entire phone number. For example, enter 13171002997 or 3171002997 to search for interactions sent to +1 317-100-2997.
The filter cannot search for a partial phone number and it cannot process hyphens. You can omit the country code.
To
Displays information for interactions sent to the selected email addresses.
Enter the full email address, such as person@example.com. The filter cannot search for a partial address.
Filter for multiple addresses at one time by entering other addresses and searching again.
When searching for a phone number, enter the entire phone number. For example, enter 13171002997 or 3171002997 to search for interactions sent to +1 317-100-2997.
The filter cannot search for a partial phone number and it cannot process hyphens. You can omit the country code.
ANI
Displays interactions with the selected ANIs.
You can use partial numbers that start from the beginning of the number. Numbers can optionally include the country code: 1317222 or 317222 are valid partial searches. However, you cannot search for a partial string that occurs in the middle of a number. For example, if the entire number is 3172223333, then 7222 is an invalid search.
You can search for multiple numbers by searching again.
DNIS
Displays information for interactions with the selected original DNIS number. This DNIS number was dialed at the beginning of the interaction.
Enter only the DNIS number. For example, enter 13172223333. Do not include other characters such as +, -, or ( ).
You can use partial numbers that start from the beginning of the number. Numbers can optionally include the country code: 1317222 or 317222 are valid partial searches. However, you cannot search for a partial string that occurs in the middle of a number. For example, if the entire number is 3172223333, then 7222 is an invalid search.
Filter for multiple numbers at one time by entering other numbers and searching again.
Direction
Displays information about interactions of the selected directions.
Whether the interaction was inbound, outbound, or inbound/outbound.
Queue
Displays interactions associated with the selected queues.
Flow Version
Displays interactions associated with the selected IVR flow version.
Participant
Displays information about the type of participant: internal, external, or all.
Conversation Duration
Displays interactions of the selected duration.
To search for interactions of a custom duration, select the timeframe and use the controls to set the duration:
Range: Displays interactions with durations within the selected range.
Above: Displays interactions with durations above the selected duration.
Below: Displays interactions with durations below the selected duration.
Total Handle
Displays interactions of the selected total handle time.
To search for interactions of a custom total handle time, select the timeframe and use the controls to set the duration:
Range: Displays interactions with total handle time within the selected range.
Above: Displays interactions with total handle time above the selected duration.
Below: Displays interactions with total handle time below the selected duration.
 of a column, and then drag and drop to reorder it within the column picker.