Virtual Agent performance dashboard
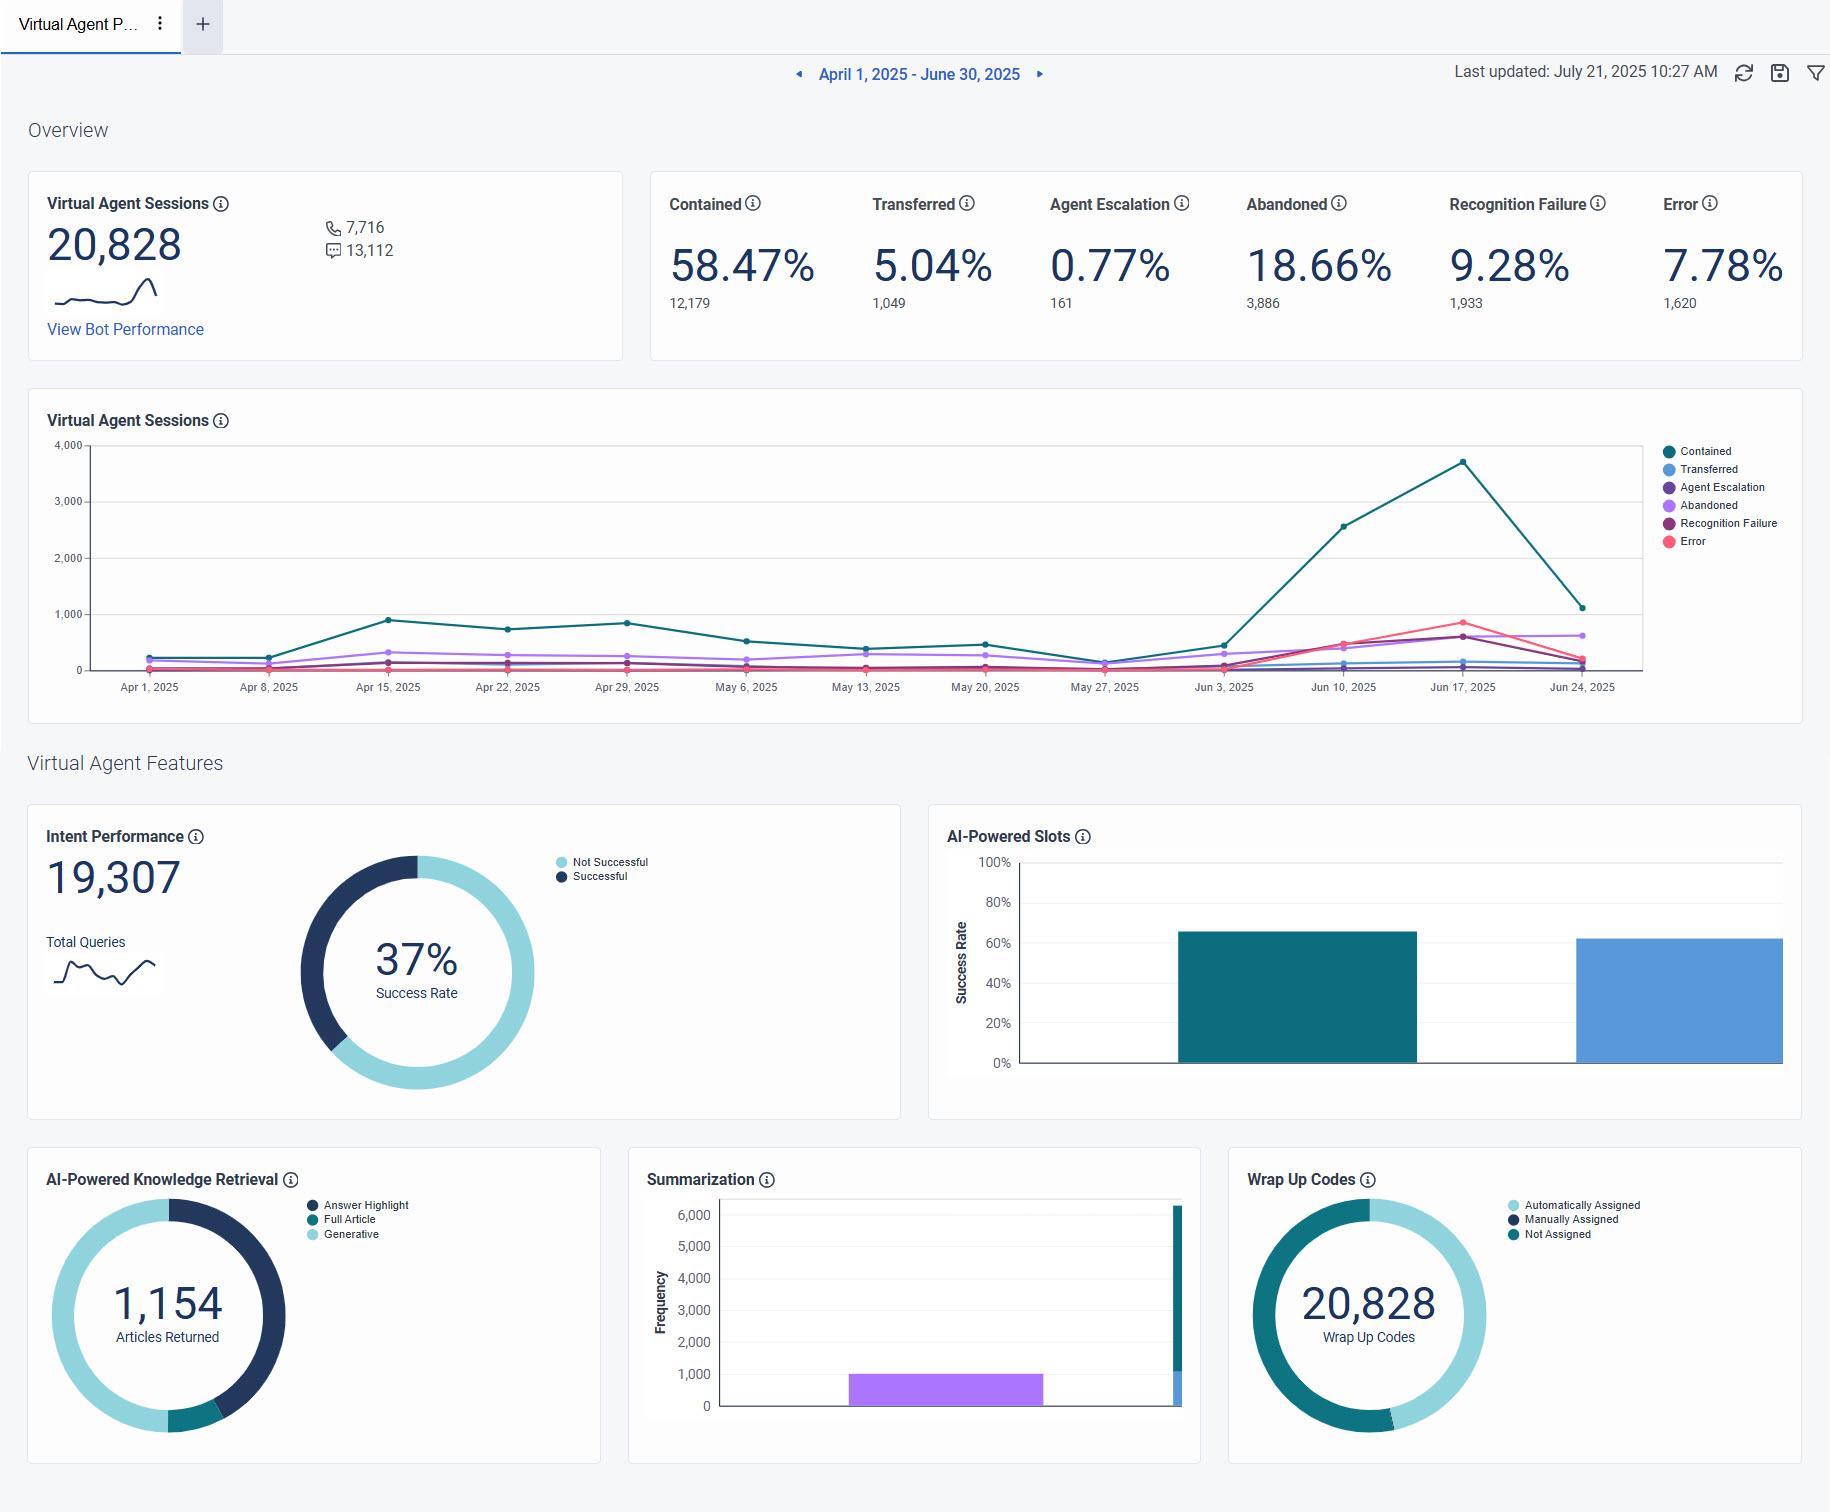
The Virtual Agent performance dashboard provides customers with comprehensive analytics and information about Virtual Agents. For more information about Genesys Virtual Agent, see About Genesys Virtual Agent. The dashboard provides a holistic view of the performance of Virtual Agents and their features, including intent performance, AI-powered slots, AI-powered knowledge retrieval, summarization, and wrap-up codes.
The dashboard provides a comprehensive view of the Key Performance Indicators (KPIs) of Virtual Agent, including the containment rate, transferred rate, agent escalation rate, abandoned rate, recognition failure rate, and error rate. This dashboard enables customers to quickly understand Virtual Agent performance, identify and address performance discrepancies, improve decision making, and increase efficiency and effectiveness.
To access your Virtual Agent performance dashboard, perform the following:
- Click Menu > Analytics > Analytics Workspace.
- In the Default section, search for Virtual Agent Performance and then click the view name to open it.
Set a default time zone in the workspace
You can set the default time zone in the analytics workspace before viewing any analytics view.
To set the default time zone in the workspace, follow these steps:
- Click Performance > Workspace.
- Click Menu > Analytics > Analytics Workspace.
- On the left side, from the Time zone drop-down menu, select the required time zone as the default time zone for the analytics workspace.
Virtual Agent performance dashboard overview
The dashboard gives you insights into the performance of Virtual Agents and their features.
To see the most current data, click Refresh .
To save the view with your filter and column settings, click Save.
Use the filters panel
Use the filters panel to select and apply filters to the data in the view.
To filter the data:
- Click Toggle filters panel .
- Search or scroll to find the filter that you want to use.
- Select or enter the required filter values. For checkbox filters, select the check boxes for the values that you want to include.
- To configure additional filters, repeat the previous steps.
- Click Apply to apply your filter selections to the view.
Filter changes do not affect the data in the view until you click Apply. To discard changes that you made since you last applied the filters, click Cancel. To quickly find a filter or filter value, enter its name in the search box at the top of the filters panel. The search is not case-sensitive and does not filter the data in the view. After you select the required filter values, click Apply to filter the data.
Applied filters appear as tags. To view all the values associated with an applied filter, click the corresponding filter tag. The filters panel provides improved accessibility, including enhanced keyboard navigation, focus states, and screen reader support for filter controls, bringing the panel in line with WCAG 2.1/2.2 AA guidelines.
- Checkbox filter options are cleared by default. Select the check boxes for the values that you want to include in the filter.
- For numeric range filters, you can specify a start value, an end value, or both. A blank value does not apply a limit for that end of the range.
- For duration filters, enter the required hour, minute, or second values. Blank fields do not apply a value.
- When a filter supports multiple media types, select the appropriate check boxes. When only one media type can be selected, select the appropriate radio button. Genesys Cloud automatically prevents incompatible media type combinations.
- Only applied filters are saved with saved views, retained when the page reloads, and included in shareable view URLs. Changes that you make in the filters panel but do not apply are not saved.
- Exports use the currently applied filters. Filter changes that you have not applied are not included in the exported data.

[NEXT] Was this article helpful?
Get user feedback about articles.