Agentic Virtual Agent performance dashboard
The following permissions:
- Agentic > Virtual Agent – View (to view Agentic Virtual Agent)
- Analytics > agenticVirtualAgentAggregate – View (to query agentic virtual agent aggregates)
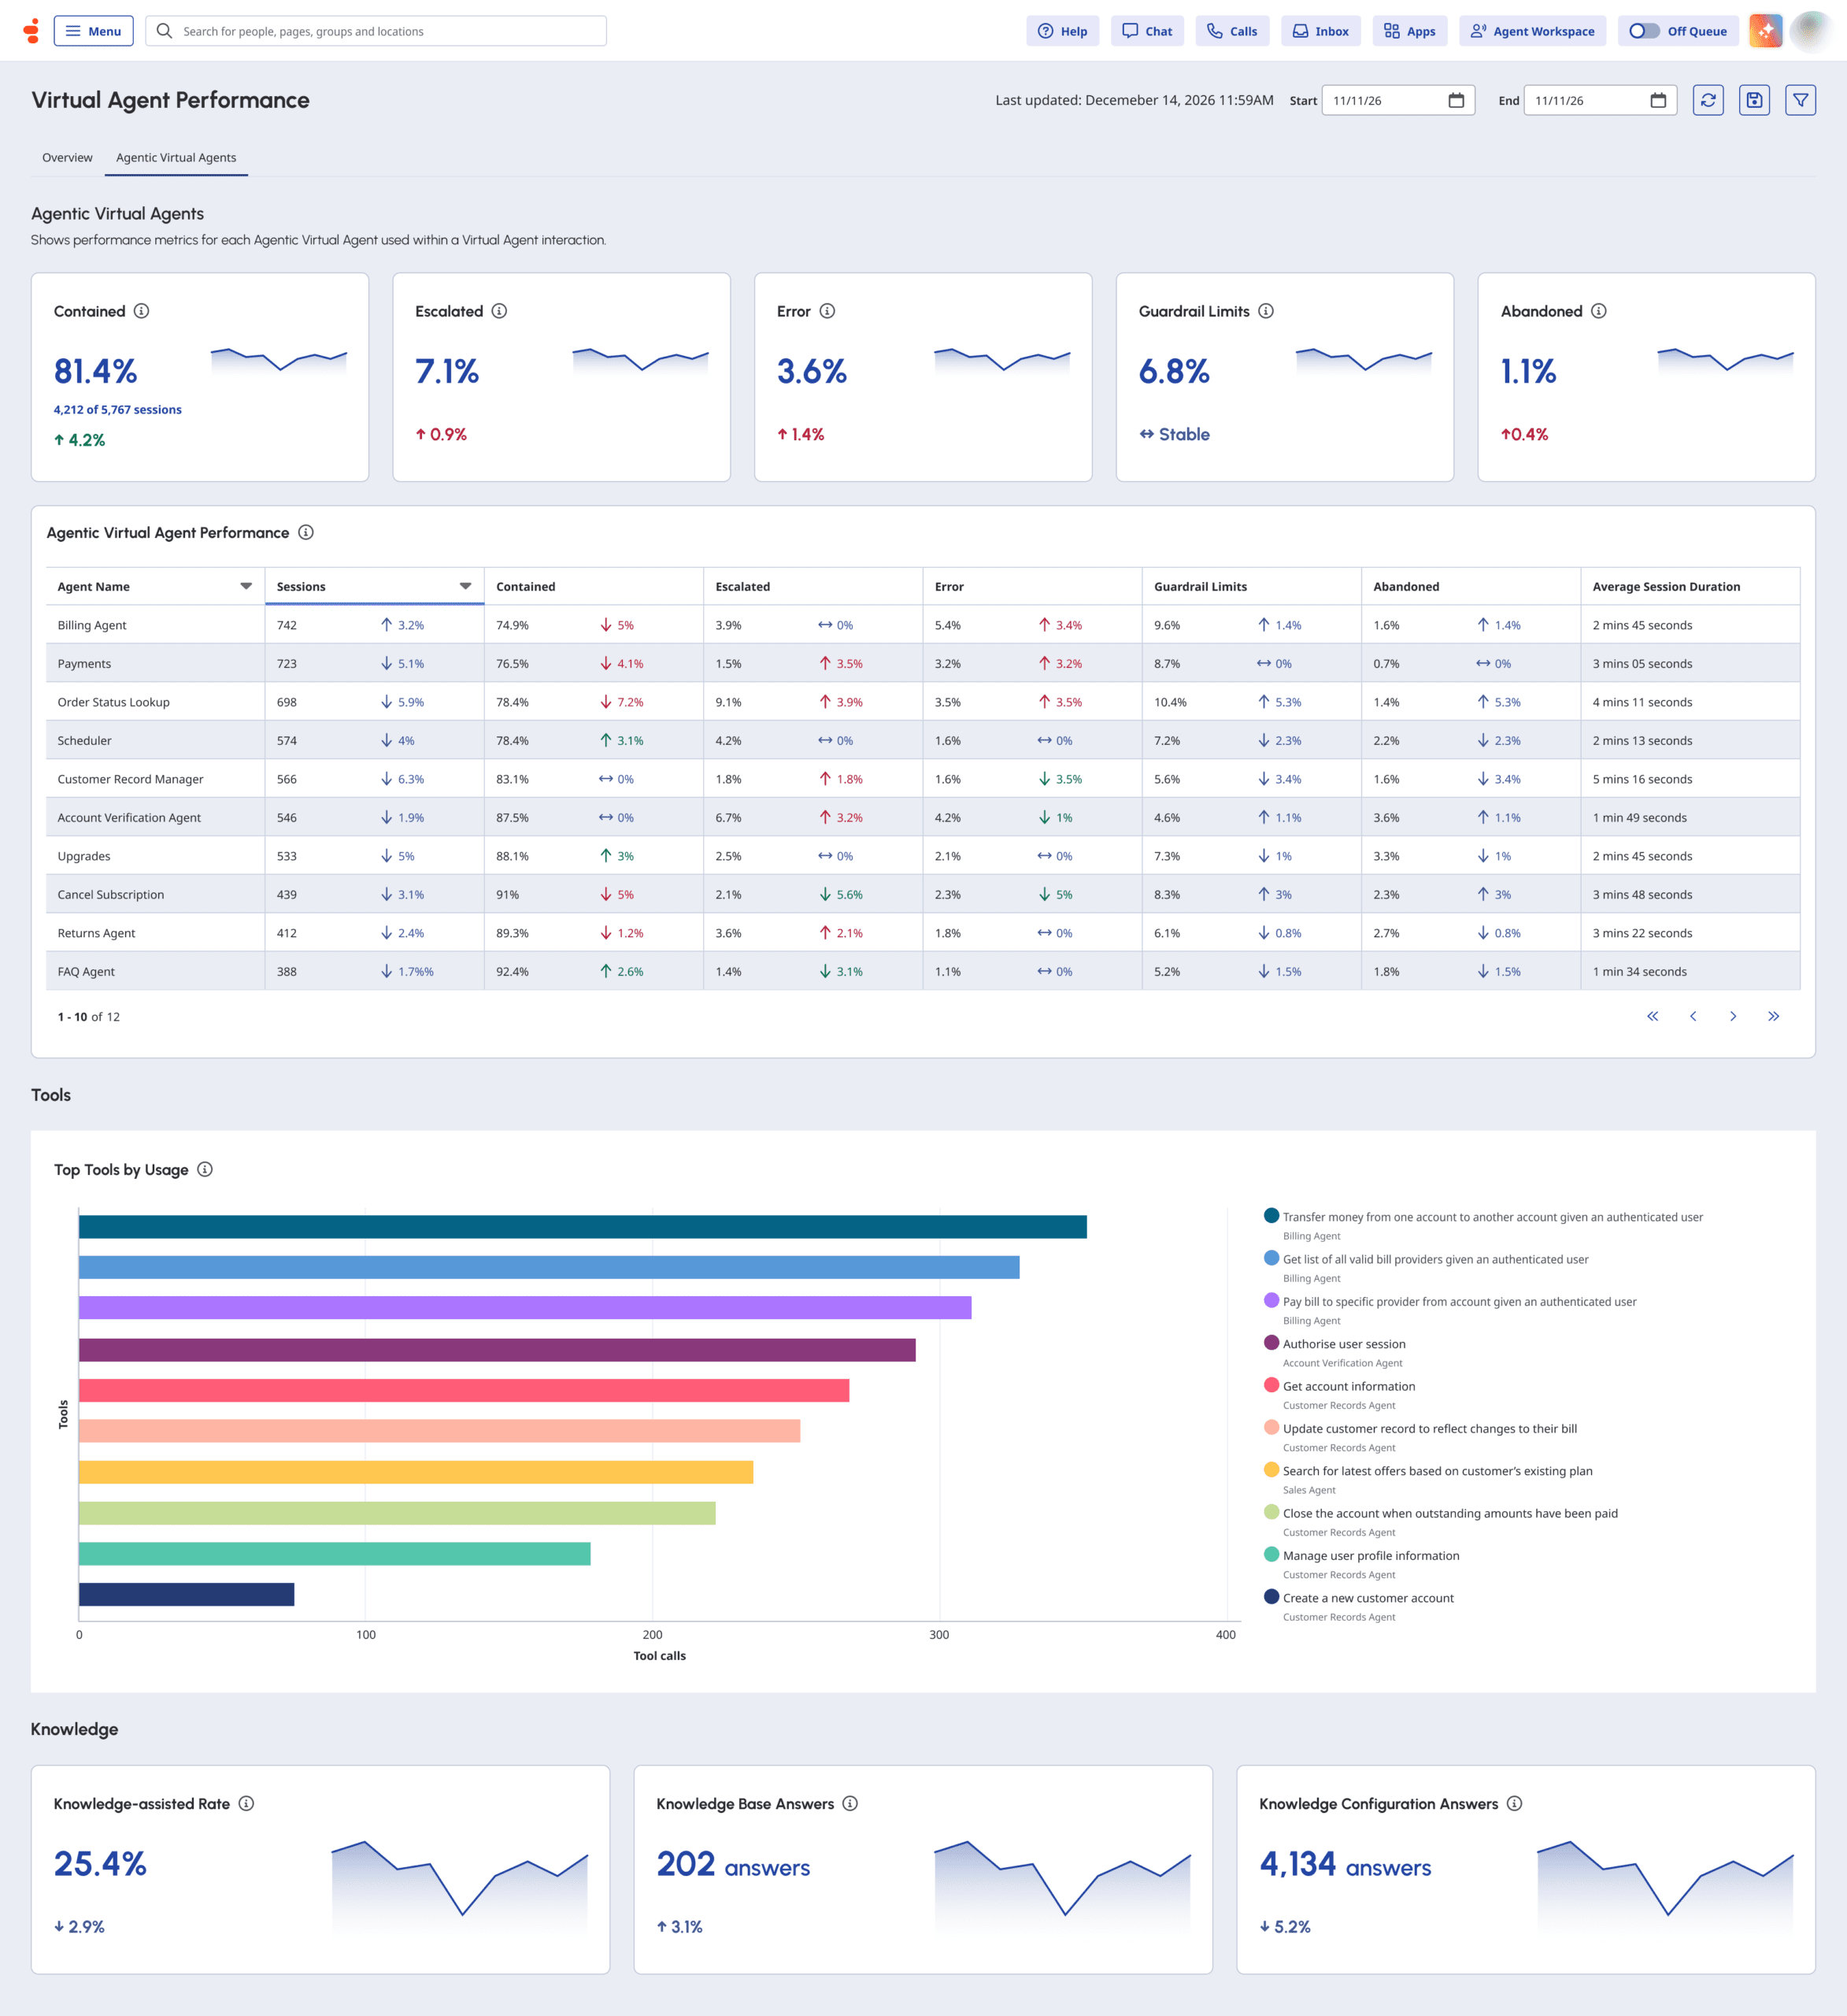
The Agentic Virtual Agent performance dashboard enables supervisors and AI builders to monitor the usage, outcomes, and performance of Agentic Virtual Agents (AVAs). The dashboard combines high-level conversation metrics, agent performance, and tool execution analytics to help supervisors understand how AVAs handle customer interactions and identify opportunities for improvement.
To access your AVA performance dashboard, perform the following:
- Click Menu > Analytics > Analytics Workspace.
- In the Default section, search for Agentic Virtual Agent Performance and then click the view name to open it.
Set a default time zone in the workspace
You can set the default time zone in the analytics workspace before viewing any analytics view.
To set the default time zone in the workspace, follow these steps:
- Click Performance > Workspace.
- Click Menu > Analytics > Analytics Workspace.
- On the left side, from the Time zone drop-down menu, select the required time zone as the default time zone for the analytics workspace.
Agentic Virtual Agent performance dashboard overview
The dashboard provides insights into the performance of AVAs and their features.
To see the most current data, click Refresh .
To save the view with your filter and column settings, click Save View.
To customize analytics views, use the date filter.

To filter metrics by date or configure a custom date range, use presets. When filtering metrics for this view, select any custom date range up to 6 weeks.
To use a preset to filter metrics, complete the following steps:
- To display the date filter, click the date.
- In the Presets list, select a preset date option.
Date presets
| Presets | Description |
|---|---|
| Today | Shows data for the time period that includes the current interval. |
| Yesterday | Shows data for the previous day. |
| This week | Shows data for a Sunday through Saturday time period. |
| Last week | Shows data for the previous week, Sunday through Saturday. |
| Previous 7 days | Shows data for the previous seven days. |
| This month | Shows data for the current month, with no extra days. |
| Last month | Shows data for the previous calendar month with no extra days. |
| Previous 30 days | Shows data for the previous 30 days. |
| This month by week | Shows data for the current calendar month starting on Sunday and ending on Saturday, including extra days if the month does not start on Sunday or end on Saturday. |
| Previous 3 months | Shows data for the previous 3 months. For example, Nov 1, 2022 – Jan 31, 2023. |
| Day | Shows data for a single 24-hour day. |
| Week | Shows data for a Sunday through Saturday time period. |
| Month | Shows data for the exact month with no extra days. If the current month is selected, you can see the data up to the current date. |
| Month by Week | Shows data for a calendar month starting on Sunday and ending on Saturday, including extra days if the month does not start on Sunday or end on Saturday. |
- To use a custom date range to filter metrics, complete the following steps:
- Click the date to display the date filter.
- Select a start date and an end date on the calendar.
- Click Apply.
- To view data for a different time period using the same date presets, click the arrows on either side of the date display. For example, to view data for the previous day, click the Day preset, and then click the arrow on the left side of the date.
- To view data for a different time zone using the same date presets, from the Time zone drop-down menu, select the required time zone. You can create and save reports with the same selected time zone.
When each row shows a day, click a row to view that day’s 30-minute intervals.
You can filter the information by virtual agents, media types, and message types. The supported media types are voice, chat, and message.
To filter the information:
- Click Toggle filters panel .
- Search or scroll to select the filter you want to use. The dashboard reflects the data based on one or more filters selected.
The Agentic Virtual Agents performance dashboard has two sections as follows:
Agentic Virtual Agents
Tools
In this section, let us discuss them in detail.
Agentic Virtual Agents
The Agentic Virtual Agents section provides a high-level summary of conversation outcomes for your AVAs during the selected time period. This section provides insights about the following:
- The percentage of sessions that were successfully completed by the AVA without escalation.
- The percentage of sessions that were transferred to a human agent.
- The percentage of sessions that ended because of an application or processing error.
- The percentage of sessions that ended because the AVA reached a configured guardrail limit.
- The percentage of sessions that ended because the customer disconnected or the session timed out before the interaction was completed.
Use this section to:
- Evaluate how effectively your agents resolve customer interactions.
- Identify conversations that require human assistance.
- Monitor outcomes that indicate opportunities for improvement.
- Assess overall AVA performance.
- Identify trends that require more investigation or optimization.
Contained
Displays the percentage of Agentic Virtual Agent sessions that completed successfully. This metric applies only to the AVA session and does not indicate whether the customer’s overall interaction was fully self-served or included assistance from a live agent.
This widget displays:
- Percentage of contained sessions
- Number of contained sessions out of total sessions
- Trend compared with the previous time period
Escalated
Displays the percentage of AVA sessions that are transferred to a human agent. This metric helps you identify how often conversations require agent assistance and evaluate opportunities to improve automation.
This widget displays:
- Percentage of escalated sessions
- Trend compared with the previous time period
Error
Displays the percentage of sessions that ended because of an application or processing error.
This widget displays:
- Percentage of sessions ending in error
- Trend compared with the previous time period
Guardrails
Displays the percentage of sessions that ended because the AVA reached a configured guardrail limit. Guardrails help ensure that conversations remain within configured safety and operational boundaries. This metric helps you understand how often guardrail policies affect customer interactions.
This widget displays:
- Percentage of sessions affected by guardrails
- Trend compared with the previous time period
Abandoned
Displays the percentage of sessions that ended because the customer disconnected or the session timed out before reaching a successful outcome. This metric helps you identify sessions where customers left after receiving the information they needed, as well as sessions that ended before a successful outcome.
This widget displays:
- Percentage of abandoned sessions
- Number of abandoned sessions out of total sessions
- Trend compared with the previous time period
Agentic Virtual Agent Performance
The AVA performance table summarizes the performance of each AVA during the selected time period. This metric helps you compare AVAs, identify trends, and determine which agents require optimization.
This AI agent performance section provides the following metrics.
| Column | Description |
|---|---|
| Agent Name | Name of the AVA. |
| Sessions | Total number of sessions handled by the AVA during the selected time period. |
| Contained | |
| Escalation | Percentage of sessions transferred to a human agent. |
| Error | Percentage of sessions that ended due to an error. |
| Guardrails | Percentage of sessions that ended because the AVA reached a configured guardrail limit. |
| Abandoned | Percentage of sessions that ended because the customer disconnected or the session timed out before completion. |
| Average Duration |
You can sort the table by Agent Name or Sessions. Percentage-based columns display the rate for each outcome and are not sortable.
Tools
The tools section provides insights into how your AVAs use tools to fulfill customer requests during conversations.
The tools section provides insights about the following:
- Tools that were used most frequently during the selected time period, including the associated AVA, total tool calls, and usage trends.
- Percentage of AVA sessions that used either the knowledge base or knowledge configuration to assist in resolving customer requests.
- Number of successful responses generated using the knowledge base.
- Number of successful responses generated using knowledge configuration.
This metric helps you:
- Understand the tools that are used most frequently.
- Identify trends in tool usage.
- Evaluate how tool execution contributes to overall agent performance.
- Improve automation and customer outcomes.
Top Tools by Volume
The Top Tools by Volume chart displays the 10 most frequently executed tools during the selected reporting period.
For each tool, the chart includes the following:
| Column | Description |
|---|---|
| Tool | Name of the tool and the AVA that used it. |
| Tool Calls | Total number of times the tool was used during the selected time period. |
This metric helps you:
- Identify the most frequently used tools across your AVAs.
- Monitor changes in tool usage over time.
- Understand which AVAs rely on specific tools.
- Identify opportunities to optimize tool usage and improve agent performance.
Knowledge
The Knowledge section provides insights into how AVAs use knowledge sources to assist customers during conversations.
This metric helps you:
- Measure the adoption and effectiveness of knowledge-assisted interactions.
- Understand how often the knowledge base and knowledge configuration contribute to successful customer responses.
Knowledge-assisted Rate
Displays the percentage of AVA sessions that used knowledge sources to assist in resolving customer requests during the selected time period. This metric helps you understand how frequently your AVAs leverage knowledge sources to generate responses and support customer interactions.
This widget displays:
- Percentage of total AVA sessions that used knowledge resources.
- Trend compared with the previous time period.
- Trend chart showing changes in knowledge-assisted sessions over time.
Knowledge Base Answers
Displays the total number of successful responses generated using the knowledge base during the selected reporting period. This metric helps you understand how often your AVAs successfully retrieve and use the knowledge base content to answer customer requests.
This widget displays:
- Total number of successful knowledge base answers.
- Trend compared with the previous time period.
- Trend chart showing changes in successful knowledge base answers over time.
Knowledge Configuration Answers
Displays the total number of successful responses generated using knowledge configuration during the selected time period. This metric helps you understand how often your AVAs successfully use configured knowledge resources to answer customer requests.
This widget displays:
- Total number of successful knowledge configuration answers.
- Trend compared with the previous time period.
- Trend chart showing changes in successful knowledge configuration answers over time.
[NEXT] Was this article helpful?
Get user feedback about articles.